For licensed mold assessors

Every finding,
pinned to a
measured plan.

Scan the room with LiDAR. Pin findings, moisture readings, and lab samples where you took them. Export a report whose photos show exactly where you stood.

Coming soon to theApp Store
iOS 18 · LiDAR scanning needs a Pro iPhone or iPad
9:41
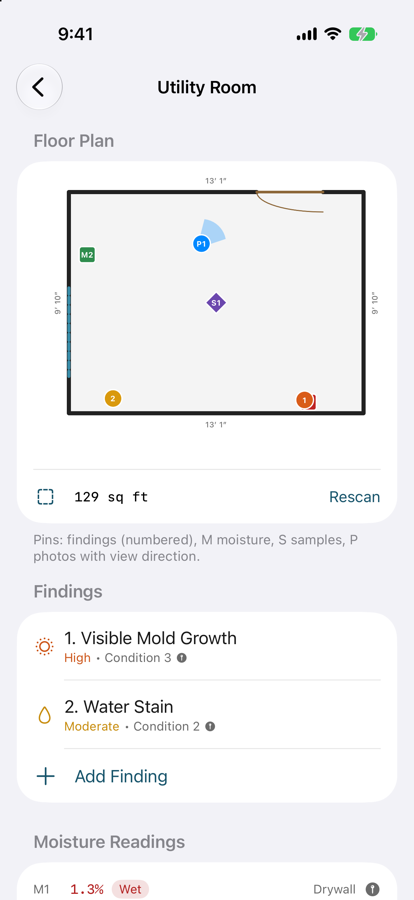
Utility Room
Floor Plan
129 sq ftRescan

Pins: findings (numbered), M moisture, S samples, P photos with view direction.

Findings
1
Visible Mold Growth
High · Condition 3
2
Water Stain
Moderate · Condition 2

Walk the room. LiDAR measures every wall, door, and window.

  • IICRC S520 conditions
  • Per-material moisture thresholds
  • Magnus dew point
  • Chain of custody
  • Located photos
  • Voice notes on the scan clock
  • Restorable backups

One visit, one record

01

Open the inspection

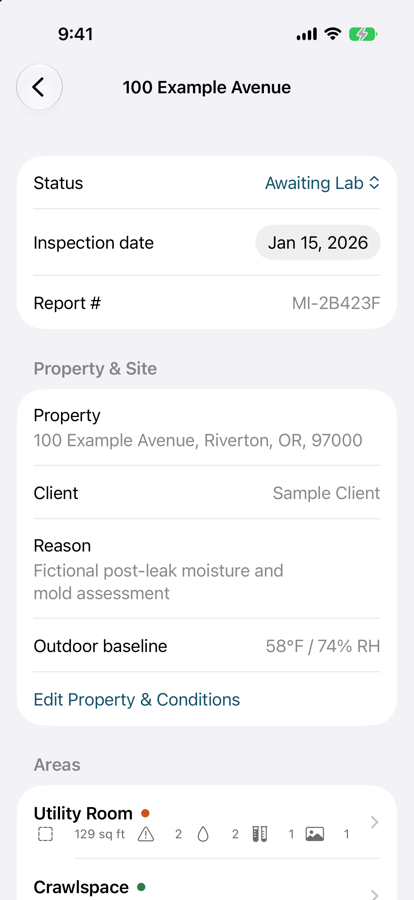
Property, client, reason for the visit, moisture history, and outdoor temperature and humidity at arrival and departure.

02

Scan each area

One walk-through per room or zone. RoomPlan measures walls, doors, and windows and computes the floor area.

03

Pin the evidence

Findings, meter readings, lab samples, photos, and voice notes land on the plan where they were captured.

04

Export the record

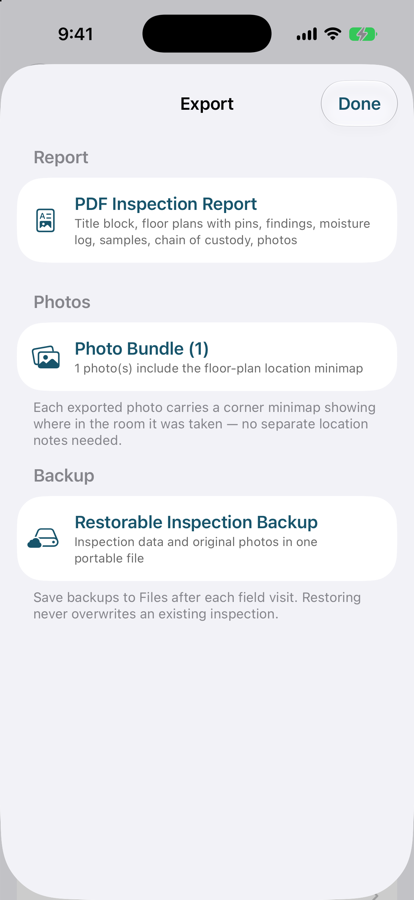
A multi-page PDF, a bundle of located photos, and a restorable backup — from the same inspection, in one tap.

Evidence that knows where it was taken.

The most common complaint about inspection software is photos that can’t be placed. Here the camera’s position and heading are captured with every mid-scan shot, so the plan, the photo, the voice note, and the timestamp all point at the same spot.

Located photos

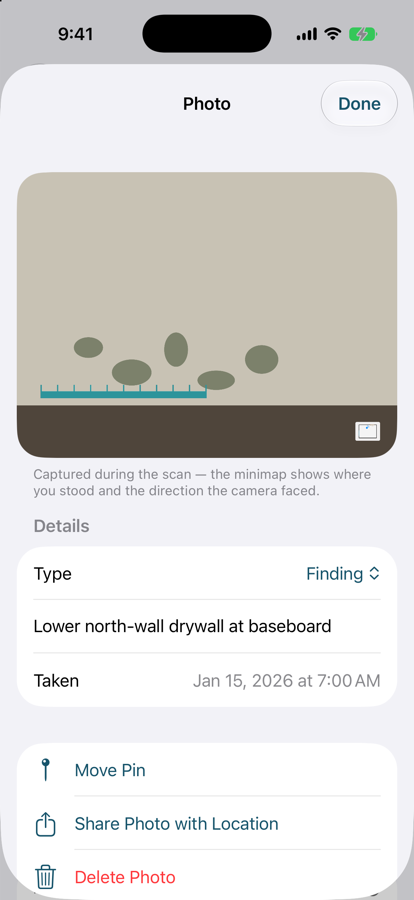
A minimap in every export

Mid-scan photos store the camera pose. The exported JPEG and the PDF both carry a corner minimap with the dot and view cone.

  • 1
    Finding
    circle · severity color
  • M1
    Moisture reading
    square · dry / elevated / wet
  • S1
    Lab sample
    diamond · chain of custody
  • P1
    Photo
    dot + cone · where you stood
Pins

Shape and color mean something

Circles are findings by severity, squares are meter readings by classification, diamonds are samples. Labels match the report tables.

Scan startDone
P1
0:42
1:05
P2
1:48
2:20
P3
2:55
0:003:12
3 photos · 2 voice notes · one scanOffset
Scan timeline

One clock for the whole scan

Photos and voice notes both record seconds since the scan began, so evidence from the same moment cross-references in the report.

Try the rules

The math lives in the models, not the screens.

These instruments run the same functions the app runs in the field — the Magnus dew point, the per-material moisture thresholds — ported line for line.

Environmental reading

Dew point & condensation risk

Every temperature and humidity reading derives its dew point on the spot. Surfaces within 5 °F of it are flagged.

Dew point
56.4°F
spread 15.6 °F
Clear
γ = 17.62·T꜀ / (243.12 + T꜀) + ln(RH / 100)
T_dew = 243.12·γ / (17.62 − γ)        // Magnus
risk  = T − T_dew < 5 °F
Moisture reading

Material-specific thresholds

The same meter value means different things in drywall and in wood. The app classifies each reading by its substrate.

Meter value0.90 %
0elevated ≥ 0.8 %wet ≥ 1 %2
Classification
Elevated
Drywall · Porous
Photo location

Where you stood, which way you looked

Tap or drag on the plan to move the camera. Turn it with the heading slider. This is the pose every mid-scan photo stores.

13′ 1″13′ 1″9′ 10″9′ 10″P1
world x
0.60 m
world z
0.30 m
yaw
0.960 rad
// frame.camera.transform → PlanPose
c2   = (-0.82, ·, -0.57)      // column 2 = camera +Z
yaw  = atan2(-c2.x, -c2.z)   = 0.96

// Plan projection (shared with Roomantic)
canvasX = -worldX            = -0.60
canvasY = -worldZ            = -0.30

// View cone: drawn along -Y, rotated by -yaw
rotate(-55.00°)

The minimap burned into the exported photo. Same renderer, same palette, smaller scale.

IICRC S520
Condition 1
Normal fungal ecology
IICRC S520
Condition 2
Settled spores / trace contamination
IICRC S520
Condition 3
Actual mold growth

The report, page by page.

One PDF from one inspection. Plans, tables, and photos are drawn by the same renderer you see on screen, and every page footer is stamped with the inspector’s license number and the issue date.

Scroll sideways to see all nine pages →
  1. Cover1 / 9
    Outdoor baseline
    74.1 °F61 % RH59.8 °F dew
    Lic. MRSA-0000Issued 2026-09-01
    Cover
    Title block, property, client, inspector license, outdoor baselines.
  2. Area plan2 / 9
    1 Visible growthM1 Wet 22 %S1 Air sampleP1 Photo
    Lic. MRSA-0000Issued 2026-09-01
    Area plan
    Measured floor plan with numbered pins and a legend.
  3. Findings3 / 9
    Lic. MRSA-0000Issued 2026-09-01
    Findings
    Category, severity, S520 condition, substrate, affected area.
  4. Moisture log4 / 9
    Lic. MRSA-0000Issued 2026-09-01
    Moisture log
    Every reading with material, meter mode, and classification.
  5. Environmental5 / 9
    Lic. MRSA-0000Issued 2026-09-01
    Environmental
    Temp, RH, derived dew point, condensation flags.
  6. Lab samples6 / 9
    Lic. MRSA-0000Issued 2026-09-01
    Lab samples
    Type, pump volume, outdoor control, lab, status.
  7. Chain of custody7 / 9
    Relinquished by
    Received by
    Lic. MRSA-0000Issued 2026-09-01
    Chain of custody
    Sample manifest with relinquished / received signature lines.
  8. Located photos8 / 9
    Lic. MRSA-0000Issued 2026-09-01
    Located photos
    Each photo with its minimap and caption.
  9. Limitations9 / 9
    Licensed Mold Assessor
    Lic. MRSA-0000Issued 2026-09-01
    Limitations
    Scope, limitations, and the inspector's signature.

Built like a field instrument.

  • Inspection overview screen listing property, client, areas, and outdoor baselines
    One record per property
  • Area screen with a measured floor plan and pinned findings, readings, samples, and photos
    Evidence pinned to the plan
  • Photo detail screen showing the corner minimap with position and view direction
    Photos remember the room
  • Export screen offering the PDF report, located photos, and a restorable backup
    Report, photos, backup

Neutral surfaces, one accent, and semantic color reserved for severity and moisture state — so color always carries meaning. Screens show fictional sample data.

Inspection records, photos, and room geometry stay on the device. No account, no developer cloud, no advertising. Content leaves the app only when you export it.

Read the privacy policy

Stop explaining where the photo was taken.

Scan a room, pin a finding, and export your first located report in about ten minutes.

Coming soon to theApp Store
No LiDAR? A sample room runs the full pin-and-report workflow.Questions? Read the support guide